Candlesticks in Your HUD: Visualizing Game World Dynamics
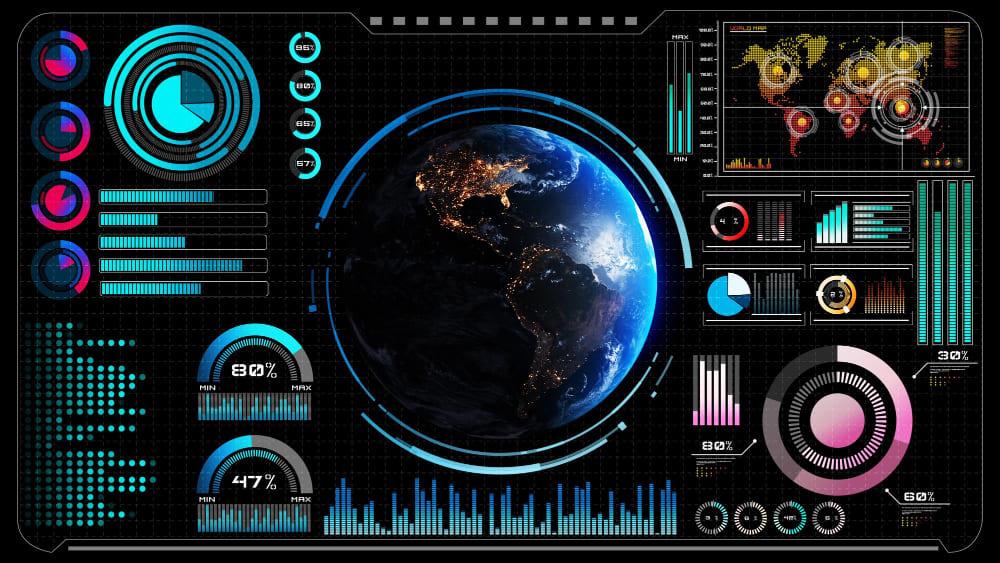
For decades, the Heads-Up Display (HUD) has been a gamer's constant companion, offering vital information at a glance. From basic health bars to complex minimaps, HUDs keep players informed without disrupting immersion. However, as virtual worlds grow in complexity, demanding sophisticated data, traditional static displays often fall short. They struggle to convey the nuanced ebb and flow of dynamic game environments, missing crucial temporal context and deeper insights into game mechanics.
Modern games often feature intricate systems: dynamic economies, evolving world events, and complex player interactions. Understanding these underlying mechanics is crucial for both player success and developer insight. Simply presenting raw numbers or a single snapshot fails to capture the temporal dimension – how things change, their range of variation, and typical behavior. This gap highlights a significant opportunity for innovation in game interface design, moving beyond mere data display to true data storytelling.
Imagine a game where a rare item's value isn't just a number, but a visual showing its typical range over time, its peak, and its lowest dip. This approach, inspired by advanced data visualization, allows players to intuitively grasp trends and volatility. It transforms abstract data into actionable knowledge, enabling more informed decisions. Clyvorapaes explores how richer visual cues can empower players and developers to navigate increasingly intricate digital landscapes.
Key Observations from Visualization Research 📊
- Visual representations of time-series data significantly enhance player comprehension of dynamic game elements and their evolution.
- Aggregated graphical displays can effectively reveal subtle, underlying patterns in player interactions or environmental state shifts over time.
- Dynamic visual metaphors provide richer context and deeper insight into game world changes than simple numerical indicators alone.
Analyzing the Potential: Deeper Game Insights 💡
Consider how a visual element, reminiscent of a "candlestick," could represent the availability of a critical resource in a game's ecosystem. The central "body" of this graphic might indicate the average quantity observed over a specific period, while extending "wicks" show the absolute highest and lowest quantities recorded. A glance would reveal not just the current amount, but also its historical volatility and typical range, offering a far richer context for strategic planning.
This visualization method extends beyond mere resource tracking. Imagine applying it to environmental dynamics: tracking temperature fluctuations in a survival game, the intensity of a magical aura, or even the frequency of enemy patrols. A series of these visual bars could illustrate whether a region is becoming more hostile, stable, or unpredictable. This allows players to make tactical decisions based on trends rather than just immediate observations. 
Furthermore, such visual tools could be invaluable for tracking player performance and progression. A series of "progress bars" could visually represent a player's success rate in challenges over a gaming session, with upward-extending segments indicating achievement and downward ones showing setbacks. This provides immediate feedback on personal trends, allowing players to identify their most effective strategies or areas needing improvement.
Implementing these sophisticated visualizations requires careful design to ensure clarity and avoid visual clutter. Information must be presented in an easily digestible and intuitive manner, even for new players. It’s not about adding more data, but about presenting existing data in a more meaningful and insightful way. The goal is to augment the player's perception, not to overwhelm their senses. Clyvorapaes is committed to pioneering interfaces that enhance understanding.
For game developers, these advanced HUD elements offer an unprecedented diagnostic tool. By visualizing aggregated player behavior or system performance, developers can quickly identify imbalances, unexpected gameplay loops, or even potential exploits. For instance, if a particular crafting material consistently shows extreme value fluctuations, it might indicate an imbalance in its acquisition or consumption rates. This allows for proactive adjustments, ensuring a more balanced experience. Clyvorapaes believes this approach can revolutionize game development.
Future Directions and Applications 🚀
- Empowered Player Strategy: Provide players with intuitive visual tools to understand game world dynamics, leading to more informed tactical and strategic decisions.
- Developer Insight & Balancing: Offer game designers and developers powerful diagnostic visualizations for identifying system imbalances and optimizing gameplay experiences.
- Next-Gen Interactive Interfaces: Pioneer innovative HUD designs that move beyond static information, fostering deeper player engagement and environmental understanding.
Comments (0)